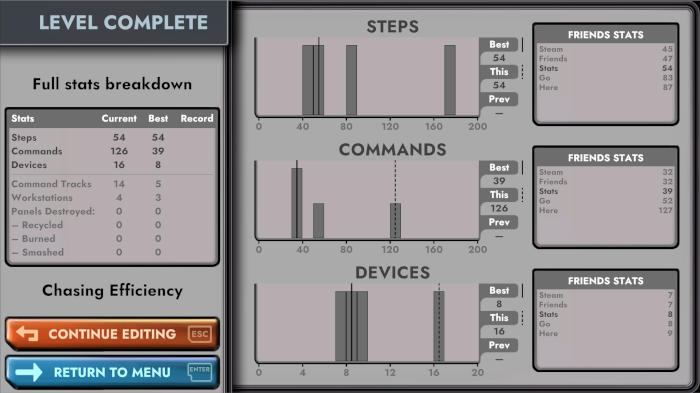
Global histograms are live!
A slightly awkward part of gamedev is when you mark something as "Coming Soon" and then take a very long time to actually get it working. This was the case with the global histograms (bar charts) for Hexahedra's puzzles, but today they are finally live!
I can't show you the scores for every single other player, but I can show you how your solutions compare globally by creating a histogram and showing where your best solutions lie on it.
 Global Histograms for level 11, Chasing Efficiency. The graphs are genuine — someone has found a quicker solution that I have, and I'm not sure how. This is great news!
The histograms are available both in the public demo and the closed beta for Kickstarter backers. If you haven't given Hexahedra a go yet, now is a great time for some friendly competition. For the levels that appear in both the demo and the beta, the stats are combined into one larger dataset for the graphs.
That's pretty much it in terms of announcements, but if you're interested in how this is all put together behind the scenes, read on.
Verifying and storing stats
Whenever you complete a level, your solution and its stats are sent to the backend stats server. To prevent dodgy folks (I've heard there are one or two on the Internet) from submitting fake stats, the first thing the server does is verify the solution — it runs exactly the same logic as the game itself, so it can check whether a solution really does solve the level as advertised.
Assuming all is well, a couple of things happen. Since November last year the server has been sending the stats to Steam's leaderboards, which the game uses for the "Friends Stats" section.
The server also stores your personal bests in a database. It's been doing this all along, but only now does it use that data to create histograms to send to the game. Whenever you submit a solution, it checks against the database to see if you've improved your best performance in any of the stats, and updates the DB row if you have.
 Personal bests pulled from the database. The "guid" column is just a unique ID for each player.
Unlike the friends data which, because of the way Steam leaderboards work, is separate for the demo and beta versions, the database tracks your best scores across both versions of the game, so we can maximize the amount of data used to build the graphs.
Building histograms
The histograms are calculated on server startup and rebuilt once an hour, so that they're cached and ready to go as soon as your game client asks for them. The database grabs all the data for each puzzle and assembles histogram data for each individual stat.
First, it decides how big a range each bar on the graph should cover — this is the histogram's "bucket size". We want all the data to fit onto the graph, so this means making sure that the biggest score in the database fits into the available buckets[1]. To standardize the display, each histogram has 20 buckets (unless the maximum value in the data is 9 or less, then we only have 10), and we use a predefined set of bucket sizes (1, 2, 5, 10, etc), so the server picks the smallest available bucket size that accommodates all the data.
It then runs through all the scores and increments the count in the relevant bucket for each one. It's this data (plus the bucket size) that gets sent to the game client for display.
Adding the player's own data
In general, this system works fine. However, caching the histograms means that if you improve your own score, that won't be reflected in the heights of the bars. That's not normally a problem — one single player's result won't have a significant impact — but if it means your personal best is now in a bucket with a count of 0, you'll have the odd experience of being in an apparently empty bit of the histogram.
So, to prevent that, when the game receives the histogram and is getting ready to display it it checks whether your PB is in an empty bucket, and sets the count to 1 if it is. We also impose a minimum 2-pixel height on non-zero bars so that they don't disappear if the tallest bar has a very large count. Your cached score, if any, will still be included in one of the other bars, so this makes the histogram slightly incorrect, but it creates a less confusing result.
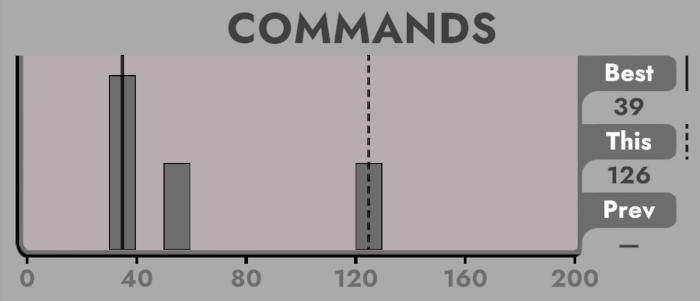
The only last thing that remains is to show which bucket you're in. The solid vertical line on the histogram is your all-time best for that stat, and the dotted line is the value for the specific solution, if that's different. If either of those lines don't fit into the histogram, they're placed on the far right-hand side.
 A histogram showing the solid "best" and dotted "this run" vertical markers.
Next steps
The histograms are complete, but this isn't quite it for records tracking. The next phase will be to track when records are broken, and by whom, so that the game can tell you when you've set a new record for a puzzle. I'll also provide a tooltip on the graphs so you can see exactly what the record for each stat is, and when it was set. There will also be Steam achievements for setting or equalling a record and a Twitter bot (assuming Twitter's still around...) that will flag up when a record is broken, and by whom if players link their Twitter account.
As you can see from the histogram at the top of this post, people have managed to log scores that are better than mine, which is one of the best parts of making a puzzle game — knowing that there's enough depth to it that not even I know all the best solutions despite having built it.
I hope you have fun solving puzzles and trying to get into the lowest buckets of the histograms, I'm looking forward to seeing all the stats rolling into the database.
Hexahedra has a Steam demo — head to the store page to try it out.
For the steps stat, it's slightly more complicated. The maximum number of devices and commands is limited by the size of the factory, but it's possible to make very long-running solutions that still solve the level eventually. To prevent some weirdly inefficient solutions skewing the data and bunching most of the results up into the low-end buckets, for steps we only insist that the best 98% of scores make it onto the histogram. The other 2% may well make it in as well if they happen to fit into the top end of the buckets. ↩︎